Journal of Law and Financial Management

|
|
Home
| Databases
| WorldLII
| Search
| Feedback
Journal of Law and Financial Management |
|
By
Dr Peter J Phillips
University of Southern
Queensland[1]
In this paper, a small preliminary sample of self managed superannuation funds (SMSFs) is investigated. The contents of the actual SMSF portfolios are examined and a number of microstructure features that characterise the SMSF portfolios are described. These empirical characteristics are juxtaposed with theoretical and empirical finance to produce an analysis of self managed superannuation funds in theory and practice. A theoretical economic rationale for the existence of SMSFs is developed and microstructure features exhibited by the SMSFs such as home bias, under-diversification, high relative weightings of blue chip securities and the deployment of infrequent portfolio revisions (buy-and-hold strategies) are reported and discussed vis-à-vis theoretical and empirical finance. The outcome is a first step towards a more complete understanding of this increasingly important component of Australia’s retirement income stream.
Microstructure, Self Managed Superannuation Funds (SMSF).
G11
The microstructure of self managed superannuation funds (SMSFs) is an important area for research that remains relatively untouched. Whilst the Australian Taxation Office publishes an aggregated summary that identifies where the trustees of SMSFs have placed their funds, this paper presents an examination of the actual portfolio structures of a small sample of ‘typical’ SMSFs administered by a large financial services firm in South East Queensland. The contents of the SMSF portfolios are investigated and a description of the components of a typical self managed superannuation fund as reflected by the information obtained from the sample is presented. A number of microstructure features that characterise SMSF portfolio decisions, structure and performance are uncovered and juxtaposed with theoretical and empirical finance.
Modern finance theory and (Markowitz) portfolio theory provide the basic theoretical structure utilised in this paper. This theoretical structure vis-à-vis the empirical characteristics of SMSFs that are exhibited by the funds in the sample is the primary focus of this paper. Hence, the approach that shall be taken herein involves the placement face-to-face of a description of the empirical characteristics of the SMSFs in the sample with the relevant pieces of modern finance theory and portfolio theory. At times, the characteristics of the SMSFs in the sample are compared with empirical results documented and explained by financial economists. For example, international investments constitute a very small component of the SMSFs. This is in accordance with the ‘home bias’ that investors have been found to exhibit and may be explained by a variety of institutional or behavioural factors (see French and Poterba (1991, pp.224–225)).
This study may be viewed as a first step towards the development of a more complete understanding of the microstructure of SMSFs. Most of the research contained in the existing literature focuses on other parts of the superannuation system and deals predominantly with retail superannuation funds. Some papers examine superannuation choice or the investor’s decision to remain with their existing or default superannuation fund (Clark-Murphy and Gerrans (2001), Clark-Murphy, Kristofferson and Gerrans (2002) and Fry, Heaney and McKeown (2007). A few papers examine the performance of superannuation funds (Gallagher (2001), Drew and Stanford (2003) and Bilson, Frino and Heaney (2004; 2005)) and there have been a handful of papers that investigate the investor’s selection of a superannuation fund and superannuation assets (Drew, Stanford and Taranenko (2001) and Drew and Stanford (2001)). The present paper complements these existing studies by extending the analysis that is extant in the literature to the microstructure of self managed superannuation funds.
This paper is organised as follows. In Section 2, a theoretical rationale for the existence of SMSFs is explored. In Section 3, the data deployed in this study are described. Whilst the sample is not large enough to permit generalisations to the broader population of self managed superannuation funds in Australia, the sample does represent a complete ‘sub-population’ or sub-set of the global population of SMSFs administered by a large financial services firm located in South East Queensland. In Section 4, the equity portions of the portfolios are dissected and various characteristics extracted and described. This includes an analysis of the number and type of publicly listed Australian companies contained in the portfolios as well as an analysis of the inclusion of small-capitalisation issues and issues that have subsequently become delisted as a result of bankruptcy or failure of the issuing company. In Section 5, a ‘typical’ SMSF equity and cash portfolio is constructed and analysed. Attention is given to the performance, risk and level of diversification of this archetypal equity and cash portfolio. Section 6 concludes the paper.
Theory and practice converge immediately when one considers the (theoretical) economic rationale for the existence of SMSFs. The empirical fact that these superannuation entities exist is something that must be explored from the point of view of modern finance theory. There are probably a large number of theoretical arguments that could be made to provide a theoretical basis for the SMSFs that exist and are being created in Australia. One could, for example, construct a theoretical rationale around the utility that investors may derive from the management of their own financial affairs and the greater number of investment choices that SMSFs provide. However, recent research implies that whilst people are initially attracted to a large variety of choices, in the final analysis limited choices actually lead to higher levels of happiness (Iyengar and Lepper, 2000). Furthermore, Benartzi and Thaler (2002) found that people are no happier with their own portfolios than with a portfolio constructed by other average investors. Whilst these results are not conclusive, the presumption that more choice makes people better off has been weakened (Benartzi and Thaler, 2002, p.1611)[2].
Whilst investor choice may yet provide the building blocks for a theoretical rationale for the existence of SMSFs, surer footing is found in the mainstream of modern finance theory. Markowitz (1952) identified the now well-known fact that covariances of asset returns play a most important role in the management of portfolio risk. If one ignores some or many covariances, the possibility that one will achieve of an optimal result is jeopardised. However, this is exactly what occurs when an economic agent holds assets in a retail superannuation fund whilst also holding a selection of ‘outside’ assets. Under such conditions, the investment manager does not know what assets the investor has outside the managed fund and, consequently, is not aware of the covariances between ‘in fund’ assets and ‘outside assets’. The investment manager does not know the composition of the remainder of the investor’s portfolio.
This problem is complicated by another equally important problem that arises when a superannuation fund deploys funds to more than one investment manager. This problem of decentralised investment management also casts doubt on the likelihood that the portfolio will be optimal, even in the absence of many beneficiaries (Sharpe, 1981). Again, the difficulty in reaching optimality arises from the ignorance of covariances. The attainment of optimality is jeopardised when portfolio managers cannot ‘see’ the whole portfolio. This casts doubt upon the practice of decentralised management and the practice of diversifying among different managers (on the basis of style and judgement) (Sharpe, 1981). Indeed, achieving an optimal portfolio outcome in the presence of the decentralised management problem is only possible under a very limited set of conditions (Sharpe, 1981).
The removal of ‘covariance ignorance’ is a possible theoretical economic rationale for the existence of SMSFs. In this paper, support for this is provided by showing that the ‘in-fund assets—outside assets’ problem and decentralised investment management problem can only be solved under very restrictive conditions. This task is made much simpler by the fact that Sharpe (1981) has already demonstrated the conditions under which decentralised investment management can achieve optimality. It is left to us to adapt (or construct an analogy) between Sharpe’s decentralised investment management problem and the ‘in-fund assets—outside assets’ problem. An appropriately constructed analogy will permit the utilisation of Sharpe’s notation and reasoning in the latter context. Once completed, this will show that the two ‘covariance ignorance’ problems can be resolved only under limited conditions and an alternative feasible solution for a utility maximising investor is the initiation of a SMSF.
In deriving a solution for the decentralised investment management problem,
Sharpe (1981, p.222–225) first obtains the solution
to a maximum problem
for a simple specification of the utility function
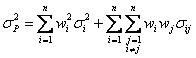
u p = t p e p - v p, where u p
is the utility of the portfolio, e p is the expected return of the portfolio, using optimum estimates of security
expected returns, v p is the variance of the portfolio and t p is the risk tolerance of the portfolio. The solution is obtained by
maximising the Largrangean function ![]() , the first order conditions of which can be expressed as follows:
, the first order conditions of which can be expressed as follows:
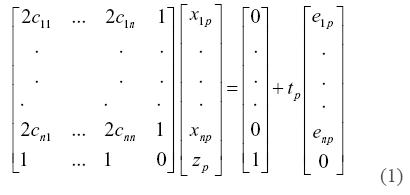
Where cij is the covariance between the returns of securities i and j and eip is the optimum estimate of the expected return of security i. For compact expression, (1) is expressed in matrix notation as follows:
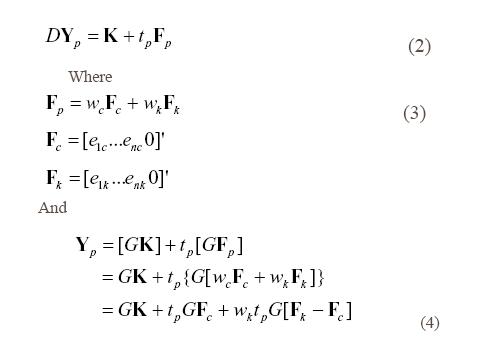
Where G is the inverse of D, [GK] is the minimum variance portfolio, [GKp] is divergences per unit of risk tolerance, GK + tpGFc is the optimal passive portfolio and wk tpG[Fk - Fc] is the optimal active divergences. Rewriting,
Yp = wc [GK + tpGFc] + wk [GK + tpGFk] (5)
Where [GK + tpGFc] is the optimal passive portfolio and [GK + tpGFk] is the optimal active portfolio. The decentralised investment management problem can be solved if the investor allocates funds in accordance with the investment managers’ abilities to predict the expected return of security i, allocating wc to be invested by a passive manager who maximises the objective function uc = ec - vc/tp and wk invested by an active manager who maximises the objective function uk = ek - vk/tp. Even though each manager acts as though his or her portion of the fund is the whole portfolio, the investor’s objective function is maximised because [GK + tpGFc] maxmises uc and [GK + tpGFk] maximises uk.
By analogy, Sharpe’s solution to the decentralised investment management problem can be easily extended to generate a solution for the ‘in-fund assets—outside assets’ problem identified previously. If the investor manages his or her ‘outside’ assets personally and allocates the other component of his or her whole portfolio to a single fund manager, then he or she simply becomes one of the two managers to whom a weighting is prescribed. That is, the ‘in-fund assets—outside assets’ problem becomes a special case of the decentralised investment management problem. Of course, if the investor undertakes no personal management of any component of his or her whole portfolio, the problem once again reverts to a decentralised management problem described by Sharpe. In the presence of many possible managers (of which the investor himself or herself may be one), Sharpe’s approach still applies but will require an estimation of the covariances among the subsets of the whole portfolio (Sharpe, 1981, p.229).
There is, therefore, a solution to the decentralised investment management problem and the ‘in-fund assets—outside assets’. The crucial point, however, is that this solution is possible only under limited conditions: (1) the agent’s marginal rate of substitution of variance for expected return is constant; (2) unrestricted short sales are possible; (3) it is possible to lead each manager to maximise the appropriate objective function; (4) all managers agree about the variance and correlations of a set of securities (Sharpe, 1981). Furthermore, a number of other issues combine to make this a ‘best case’ scenario for the solution of our problems. First, the possibility that markets are efficient (and the implications that would have for managers’ predictions) was assumed away or ignored. Second, we ignored the possibility of many clients (a many-beneficiary problem). And third, our agent had a well defined objective function (Sharpe, 1981). In the absence of some of these features, the solution to the decentralised investment management problem and the ‘in-fund assets—outside assets’ problem becomes extremely problematic and a more feasible solution to pursue for a utility maximising investor is the initiation of a SMSF.
The data considered in this investigation were obtained from a large financial services firm based in South East Queensland. The firm administers a ‘total population’ of approximately 130 self managed superannuation funds. Of these, two-thirds of the self managed superannuation funds consist predominantly of residential and commercial property and involve minimal direct management by the trustees and limited exposure to financial securities. The remaining third involve direct management of a portfolio of both real assets and financial securities by the SMSF trustees. It is this segment of the total population of funds administered by the financial services firm that the firm permitted detailed access to for the purposes of this research. Thus, the sample of self managed superannuation funds consists of 41 SMSFs where the trustees directly manage a traditional mix of assets: cash, real estate, managed funds, fixed interest securities and equities.
The financial services firm from which the data were sourced provides a range of financial services to clients, including the SMSF trustees. These services include providing financial planning advice, administering the SMSFs and performing accounting functions. Whilst the trustees of the SMSFs in this sample may have received financial advice or otherwise taken advantage of these services, the SMSFs are the product of the trustees’ decisions and have not been constructed for them by a professional financial planner, accountant or portfolio manager. Further, the trustees are ultimately responsible for the management of their SMSF. Hence, this investigation generates some important insights into the nature of the microstructure of SMSF portfolios and the investment choices that have been made by the trustees of these self managed superannuation funds.
The 41 portfolios in the sample were formed between 1998 and 2004, with all additions to the equity portion of the portfolios completed by June of 2004. Whilst the sample size is too small to permit wide-reaching generalisations regarding the total population of SMSFs in Australia, there is no reason to believe that there is anything atypical about the SMSFs in the sample that would result in a divergence in fundamental character from similar funds obtained from alternative data sources. Furthermore, the funds have passed through an annual audit process and do not exhibit any anomalous features that would lead to a non-compliance—with Australian Tax Office requirements or, more broadly, the Superannuation Industry (Supervision) Act 1993—designation being placed upon them. This ensures another level of ‘base-line’ similarity with the broader population of self managed superannuation funds in Australia.
The financial services firm from which the data were sourced administers each of the SMSFs. This role involves overseeing the placement of orders for securities with a brokerage firm, maintaining all of the necessary records and facilitating the auditing of the SMSFs via a third-party auditor to ensure the continued compliance of the SMSFs with Australian Tax Office requirements and the relevant legislation. The research results presented herein are based upon accurate and complete data concerning the portfolios in the sample and do not need to rely on the record-keeping of individual SMSF trustees. The data itself was presented as 41 individual portfolio summaries. The summaries list the cash at bank, the quantities of fixed interest securities, real estate and listed securities contained in the SMSF, the purchase dates, average cost and the weighting of each asset in the portfolio. An example of an actual portfolio summary is presented in Table 1 below.
|
Investment
|
Quantity
|
Purchase Date
|
Average Cost of each Security
|
Total Dollar Cost
|
Weighting
|
|
|
|
|
|
|
|
|
Cash at Bank
|
|
|
|
|
|
|
Macquarie Cash Management Trust
|
485,000
|
|
|
485,000
|
86.96%
|
|
Westpac Savings Account
|
2,306
|
|
|
2,306
|
0.41%
|
|
TOTAL
|
487,306
|
|
|
|
87.37%
|
|
|
|
|
|
|
|
|
Shares in Listed Australian Companies
|
|
|
|
|
|
|
PMP Communications Limited
|
1,000
|
30/06/2000
|
2.35
|
2,353
|
0.29%
|
|
St George Bank
|
586
|
4/12/1997
|
10.46
|
6,131
|
2.31%
|
|
Suncorp Metway
|
2,520
|
1/11/1999
|
9.01
|
22,697
|
6.42%
|
|
Telstra 2 Instalment Receipts
|
|
22/10/1999
|
-2,900
|
-2,900
|
|
|
Telstra Corporation Limited
|
4,000
|
5/11/1997
|
3.31
|
13,250
|
3.61%
|
|
TOTAL
|
|
|
|
41,531
|
12.63%
|
|
|
|
|
|
|
|
|
TOTAL FOR SMSF
|
|
|
|
570,368
|
100.00%
|
The average size of the self managed superannuation funds in this sample is approximately $400,000. Across all the funds in the sample a total of nine different asset classes are represented. The average dollar amounts invested in each of these nine different asset classes and the average percentage weighting attributed to each asset class in the portfolios is presented in Table 2 below. Confronted with the task of constructing a portfolio of real and financial assets, the trustees of these SMSFs appear to direct their attention to the most familiar asset classes: cash, shares in Australian companies and managed investments (unit trusts). Whilst this is not surprising, the concentration of investable funds into a small range of asset classes means that the efficient frontier available to these SMSF investors lies somewhat below that which could be obtained if other investment opportunities were carefully considered.
|
Asset
|
Mean
($)
|
Mean
(%)
|
|
Short Term Cash
|
80,822
|
18
|
|
Long Term Cash
|
26,625
|
4
|
|
Listed Australian Shares
|
159,847
|
46.9
|
|
Unlisted Australian Shares
|
999
|
0.28
|
|
Fixed Interest
|
8,879
|
1.7
|
|
Unit Trusts
|
66,247
|
18.4
|
|
Real Estate
|
50,165
|
9.5
|
|
Overseas Shares
|
3,388
|
0.78
|
|
Derivatives
|
18
|
0.012
|
|
TOTAL
|
396,995
|
|
Notes: short term cash denotes cash held in bank savings accounts or cash management trusts. Long term cash denotes cash held in term deposits. For the SMSFs contained in this sample, real estate refers to commercial property, with a small number of self managed superannuation funds holding one or two commercial properties. Derivatives denote company options listed on the Australian Stock Exchange, not exchange traded options.
The focus of the portfolios into a narrow range of asset classes, particularly Australian cash, shares and unit trusts, may be symptomatic of a higher level of (relative) risk aversion or general deficiency of confidence among these trustees. However, the data also permits the exploration of the extent to which the SMSFs reflect the broader tendency of investors to exhibit home biases or preferences for domestic equities over international investments. For example, French and Poterba (1991) discovered that U.S. investors allocated over 90 percent of their funds to U.S. securities. This behaviour leads U.S. investors to ignore over 50 percent of world’s foreign equity opportunities and forego the potential expected return-risk benefits associated with overseas investments. Similar results were discovered for Japanese investors, whilst British investors were found to hold approximately 18 percent of their portfolios in foreign stocks.
The very small allocation to overseas investments exhibited by the SMSF portfolios is an indication of home bias. This is consistent with empirical results documented in numerous studies. Because Australia’s stock market accounts for such a small fraction of the world’s equity opportunities, the opportunities forgone by home biased Australian investors are of a greater order of magnitude. In Australia, home bias leads Australian investors to ignore more than 90 percent of the world’s foreign equity opportunities. Of course, the most important thing from a portfolio management point of view is that there are potentially considerable risk reductions available to investors who invest in overseas markets. Whilst the returns generated by the world’s stock markets have become more closely correlated, the correlation is far from perfect and could be exploited by portfolio managers to increase the expected return of their portfolios and decrease the total risk of their portfolios. A variety of factors, including institutional factors and transactions costs, could lead investors to forgo the potential benefits of international diversification. However, it is also possible that investors (mistakenly) attribute additional risks to overseas investments due to their unfamiliarity with foreign business environments (French and Poterba (1991, p.225) and Tversky and Heath (1991)). Whatever the case may be, the SMSFs in this sample do appear to exhibit considerable home bias.
In addition to obvious home bias, the SMSF trustees also exhibit strong preferences for particular asset classes and allocate only small proportions of their investable funds to others. Whilst some of the SMSFs contain long term cash investments (term deposits), real estate and overseas shares, on the whole these are not popular investment choices with 93 percent, 83 percent and 87 percent of funds having zero holdings of these asset classes, respectively. The dominant asset classes are short term cash (at bank or invested in a cash management trust), listed unit trusts and listed Australian shares. None of the funds hold a zero short term cash balance and only 2.40 percent of funds do not hold shares in listed Australian companies. Given this dominance, the focus of the remainder of this paper is the dissection of the equity portions (including listed unit trusts) of the SMSF portfolios.
In this sample, short term cash investments, listed unit trusts and Australian shares account, on average, for more than three-quarters of the total value of the portfolios. Whilst this is important information, a more detailed account of the equity portion of the portfolios reveals a number of features of the SMSFs that are not discernible from an analysis of the aggregated data. In this section, the microstructure characteristics of the equity portions of SMSFs are reported. This analysis reveals: (a) the Australian companies in which the SMSF investors have invested; (b) the representation in the portfolios of small capitalisation issues versus large capitalisation issues; (c) the representation of particular industry sectors; (4) the extent of the ‘speculative component’ of the portfolios, including a consideration of investments in now-delisted or bankrupt business enterprises; and (5) the weighting schemes applied by the SMSF trustees to the securities in the portfolios, the frequency of the trading exhibited by the portfolios and the tendency to form the portfolios over a very short period.
On average, each portfolio in the sample contains an investment in the shares of twelve different listed Australian companies and listed unit trusts. Whilst the average number of different equity securities held in the self managed superannuation fund portfolios is quite small, the 41 SMSFs in the sample invested in a total of 152 different Australian companies listed on the Australian Stock Exchange. The five most popular[3] Australian companies among the SMSF trustees comprising the sample are: (1) Australia and New Zealand Banking Corporation; (2) National Australia Bank; (3) Suncorp Metway; (4) Telstra Corporation; (5) and Woolworths. These companies were each present in approximately half of the SMSFs. The next five most popular are: (1) BHP Billiton; (2) Fosters Group Limited; (3) Paperlinx; (4) Commonwealth Bank of Australia; and (5) Commonwealth Property (Office). These companies and property trusts were each present in approximately one-quarter of the SMSFs. This information is presented in Figure 1 below.

An interesting question arises at this point: Do the SMSF trustees exhibit home bias at home? ‘Home bias at home’ is the observed tendency of investors to exhibit a preference for companies located within close geographical proximity, even within their own national borders. As mentioned earlier, investors have been observed to exhibit home bias or the tendency to invest domestically rather than overseas. Coval and Moskowitz (1999) found that the tendency for investors to prefer investments that are closer to home also applies to domestic portfolios. That is, investment managers prefer to invest in firms that are locally headquartered. The SMSFs in the sample are located in South East Queensland and home bias at home would result in a tendency for the SMSFs to favour firms headquartered in Queensland.
The SMSF trustees in the sample invested in a total of 152 Australian companies. Of these, approximately 12 percent are Queensland companies with headquarters in that state, with the most popular Queensland-based companies being Suncorp, ABC Learning, Flight Centre and New Hope Corporation. This is not strong evidence for ‘home bias at home’, although some of the more ‘obscure’ selections (for example, New Hope Corporation and Buderim Ginger), may be the product of ‘home bias at home’. The absence of strong evidence for ‘home bias at home’ does not rule out the possibility that the geographical proximity of certain companies did indeed lead some of the SMSF trustees to include these companies in their portfolios. Also, when considering whether the SMSF trustees exhibit home bias at home, allowance must be made for the relatively low number of Australian companies headquartered in Queensland.
Another important characteristic of the SMSF portfolios is the absence of high levels of diversification. The inclusion, on average, of just twelve equity securities in the SMSF portfolios has significant implications for the diversification of these funds. In their classic study, Evans and Archer (1968) concluded that an investor required approximately 15 to 20 equity securities to fully diversify his or her portfolio and remove the effects of non-systematic risk on the total risk of the portfolio. More recent research has determined that the number of equity securities required to achieve full diversification has increased in recent decades as individual shares have become more volatile. Campbell, Lettau, Malkiel and Xu (2001) suggest that the number of shares required is now approximately 50. The equity portions of the SMSF portfolios may be exposed to considerable levels of diversifiable risk. This is one feature of SMSFs that cannot be ascertained by an examination of aggregated data.
The under-diversification of the SMSFs is in accordance with the extant empirical investigations that have studied the usefulness of diversification as a guide to what one might expect of peoples’ portfolios. In particular, using Federal tax return data and the Federal Reserve Board’s 1962 survey of the financial characteristics of consumers, Blume and Friend (1975) found that, contrary to the assumptions that underlie certain parts of finance theory, individuals do not hold diversified portfolios. In fact, Blume and Friend found that (American) households at the time tended to report dividends from only one or two firms. Explanations for this behaviour include (1) heterogenous expectations (Blume and Friend (1975, p.597); (2) the inability of the investor to optimise by assessing the covariances of his or her entire portfolio; and (3) transactions and decision costs. Most interesting, however, is the explanation developed by Goldman (1979). Specifically, Goldman (1979, p.511) explains how a favouritism principle may be utilised by investors in place of the diversification principle:
“We normally give more weight to our favourite foods (than is considered normal) in the composition of our grocery bundle, to our favourite divertissement in our entertainment bundle etc. The diversification principle emphasises the interactions of goods; the favouritism principle underscores the individual (in vacuo) attributes of each good. The relative importance of diversification to favouritism is in most choice problems dependent on circumstances—e.g., wine must be chosen in coordination with entrée but perhaps independently of the evening’s entertainment. In the context of the portfolio problem the diversification principle seems to dominate when the revision interval is short—when return distributions are tight and symmetric. However, when the revision period is long (i.e. compounded return distributions are spread out and skewed) the convolution of asset returns tends to be dominated in an essential way by one asset’s return. For optimality it is imperative that this dominating return be the favourite. Consequently, there is a tendency to asymptotically reduce the portfolio weights of all non-favourite assets”
The favouritism principle may help to explain the under-diversification of infrequently revised portfolios like the SMSFs in the sample. Not only are the SMSFs under-diversified and concentrated in well-known, Blue Chip companies, but they also exhibit infrequent revisions with most portfolios remaining stationary for a number of years (see Section 4.5 below). Depending on whether the SMSF portfolios in the sample could be assumed to concur with the class of problems analysed by Goldman (1979), a monotonic trend towards less diversification as the length of the revision period increases might be consistent with the favouritism principle and may help to explain why these infrequently revised SMSF portfolios exhibit low levels of diversification. If Goldman (1979) is correct, this may still lead to an approximately optimal portfolio solution. The further exploration of this particular juxtaposition between finance theory and SMSF practice is a topic that cannot be considered to fall within the scope of the present paper.
The representation of industry sectors in the SMSF portfolios also sheds important light upon the structures and risk profiles of the portfolios. Just over 26 percent of the companies selected for inclusion in the portfolios are constituents of the consumer staples and consumer discretionary industry classifications. This is, perhaps, an indication that the trustees invest in companies whose names or products they are familiar with. Further support for this hypothesis might be reflected by the fact that 16 percent of the companies selected for inclusion in the portfolios are drawn from the financials industry classification and a further 24 percent from the industrials and materials industry classifications. Over two-thirds of the companies selected for inclusion in the SMSF portfolios are derived from these five industry classifications:
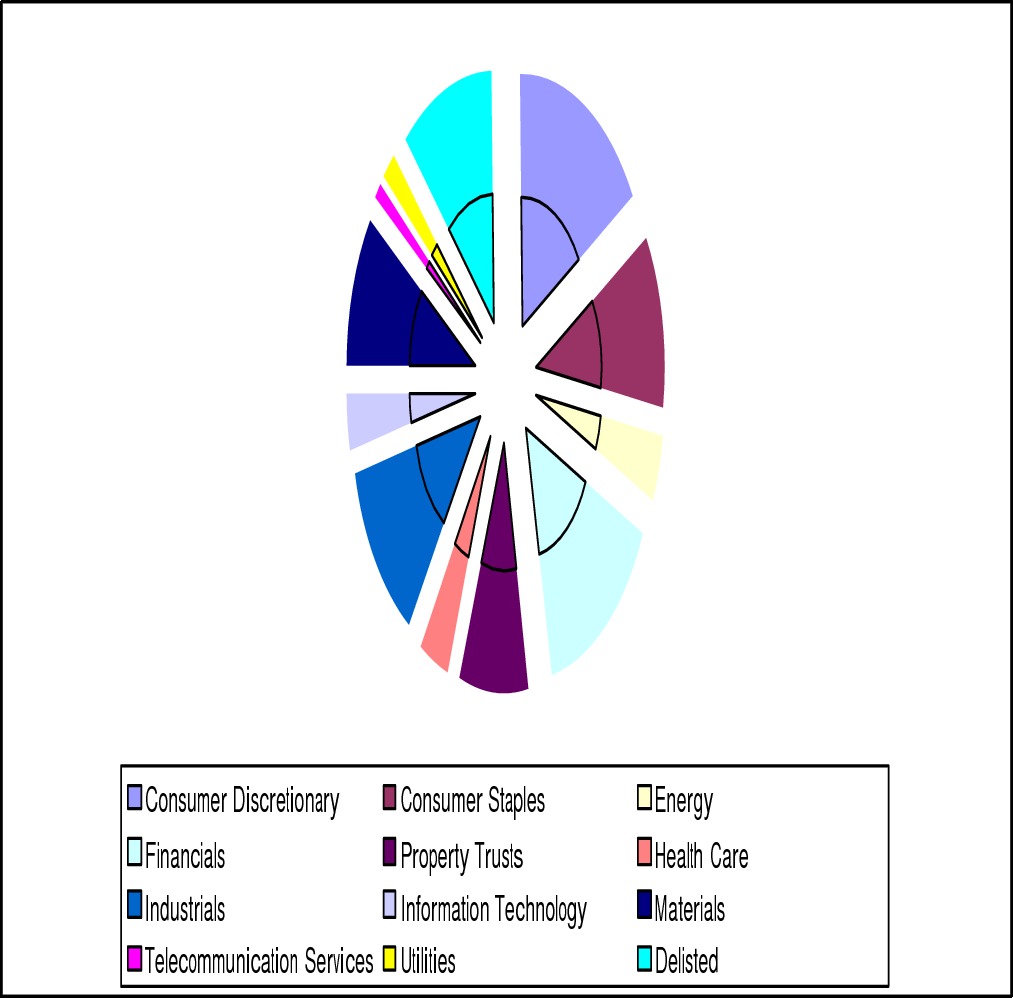
Conversely, only a very small number of the companies selected (in aggregate) by the SMSF trustees for inclusion in their portfolios are constituents of the telecommunication services (1.30 percent), property trusts (8.50 percent), information technology (1.90 percent), energy (4.60 percent), healthcare (3.90 percent) and utilities (1.90 percent) industry sectors. Not surprisingly, these sectors have a relatively low representation among their constituents of the ‘Blue Chip’ or most well-known companies. Arguably, only Telstra Corporation (telecommunication services) fits into this category vis-à-vis the major Australian banks, insurance companies, mining companies and industrial companies that constitute the sectors from which the majority of the companies represented across the SMSF portfolios were drawn.
The tendency towards well-known companies or Blue Chips is also reflected in the dominance of large capitalisation companies in the portfolios. Whilst the 41 portfolios contain a total of 152 different listed Australian companies and listed unit trusts, the dominant stock selections derive from the Australian Stock Exchange’s fifty largest capitalisation companies. This is quite evident from the discussion presented in section 4.1 above. However, further elaboration on this important characteristic of the SMSFs may be appropriate. To be precise, ten out of the twelve (83 percent) ‘most popular’ companies among the SMSF trustees are constituents of the S&P/ASX 50. Furthermore, only 9 out of the 50 (18 percent) companies that constitute the S&P/ASX 50 are not represented in at least one of the SMSF portfolios. Interestingly, the stocks that do not obtain representation in the SMSF portfolios are, by and large, lesser known companies, including Asciano Group, Centro Properties, Goodman, Orica, Telecom NZ, and Zinifex. However, Brambles, Macquarie Bank and Santos also fail to achieve selection by the SMSF trustees.
Whilst the trustees of these portfolios did not restrict themselves entirely to Blue Chip or ‘top 50’ companies, the presence of mid-capitalisation companies and, particularly, small-capitalisation issues is restricted to a reasonably small part of the portfolios. This is best illustrated by presenting and examining the details of the equity portion of another of the SMSF portfolios:
|
Investment
|
Quantity
|
Purchase Date
|
Average Cost of each Security
|
Total Dollar Cost
|
Weighting
|
|
|
|
|
|
|
|
|
Cash at Bank
|
|
|
|
|
|
|
Cash
|
29,606
|
|
|
29,606
|
8.99%
|
|
TOTAL
|
29,606
|
|
|
|
8.99%
|
|
Shares in Listed Australian Companies
|
|
|
|
|
|
|
ANZ
|
1187
|
10/05/04
|
18.33
|
21757.71
|
6.61%
|
|
APN
|
2674
|
24/03/04
|
3.79
|
10134.46
|
3.08%
|
|
BHP
|
1491
|
24/03/04
|
12.24
|
18249.84
|
5.54%
|
|
Commonwealth Office
|
16,151
|
24/03/04
|
1.19
|
19,281
|
5.86%
|
|
Coca-Cola Amatil
|
2009
|
24/03/04
|
6.81
|
13681.29
|
4.16%
|
|
Contango Microcap
|
11110
|
10/05/04
|
0.91
|
10110.1
|
3.07%
|
|
Hunter Hall Global
|
21740
|
24/03/04
|
0.93
|
20218.2
|
6.14%
|
|
Leighton Holdings
|
1913
|
10/05/04
|
7.95
|
15208.35
|
4.62%
|
|
NAB
|
826
|
24/03/04
|
31.29
|
25845.54
|
7.85%
|
|
Paperlinx
|
2350
|
24/03/04
|
4.74
|
11139
|
3.38%
|
|
Patrick Corporation
|
2836
|
24/03/04
|
4.83
|
13697.88
|
4.16%
|
|
QBE
|
1208
|
10/05/04
|
11.32
|
13674.56
|
4.15%
|
|
Ronin Property Group
|
12,844
|
10/05/04
|
1.10
|
14128.4
|
4.29%
|
|
SFE
|
1883
|
24/03/04
|
5.93
|
11166.19
|
3.39%
|
|
Suncorp
|
1262
|
24/03/04
|
14.07
|
17756.34
|
5.39%
|
|
Tabcorp
|
870
|
10/05/04
|
13.39
|
11649.3
|
3.54%
|
|
Telstra
|
3880
|
24/03/04
|
4.70
|
18236
|
5.54%
|
|
Westfield Holdings
|
1035
|
24/03/04
|
12.72
|
13165.2
|
4.00%
|
|
Woolworths
|
1702
|
24/03/04
|
11.91
|
20270.82
|
6.16%
|
|
|
|
|
|
|
|
|
TOTAL
|
|
|
|
299,370
|
90.95%
|
|
|
|
|
|
|
|
|
TOTAL FOR SMSF
|
|
|
|
328,976
|
100.00%
|
A close investigation of the structure of this SMSF portfolio reveals the presence of only two or three ‘obscure’ issues. Whilst it is not possible at this stage to determine by which processes these companies came to be included in the portfolios, there is almost certainly an independent research or information gathering process being deployed by the SMSF trustees. Importantly, this asset selection or decision-making procedure appears to have resulted primarily in the selection of well-known Australian companies and only secondarily in middle or small capitalisation issues. This has prevented any preponderance of speculative issues in the SMSF portfolios. Whilst many small capitalisation issues are represented across the SMSFs in the sample, each SMSF has a small proportion of investable funds allocated to such securities.
The final characteristic of the SMSF portfolio’s equity selections that shall be considered here is the representation in the portfolios of delisted companies or bankruptcy cases. Whilst 11.8 percent of the 152 companies originally chosen by the SMSF trustees for inclusion across their portfolios were delisted in the period 2004 to 2007, these companies were relatively unpopular selections and, in each case, were usually held by just one portfolio. Furthermore, the delisting of a particular company was not always due to bankruptcy. Rather, on many occasions the delisting was due to a far more benign set of circumstances. However, a handful of the SMSF portfolios were exposed the failures of Australian Magnesium and Sons of Gwalia. Fortunately, exposure to these failed companies amounted to less than 1 percent of the value of the affected SMSFs. Of course, the lack of large-scale exposure to failed business enterprises is to be expected given the analysis presented in earlier sections that revealed the dominance of S&P/ASX 50 or Blue Chip companies in the SMSF portfolios.
There are a number of important ‘miscellaneous’ characteristics that are revealed by thorough analysis of the microstructure of the SMSFs in the sample. Firstly, the portfolios exhibit approximately an equal-weighted weighting schedule. The apportionment of the investable funds among securities is undertaken so as to roughly equate, either by design or circumstance, the percentage of total investable funds allocated to each security. The allocations are not so precise as to lead to the suspicion that any significant degree of thought and calculation has been applied. Rather, the SMSF trustees have, on average, avoided large amounts of asymmetry in the weighting schedules they have applied with only one or two securities having a much smaller or much larger weighting than the other securities in the portfolio. For example, consider the following data concerning five portfolios selected at random from the sample:
|
Portfolio
|
Highest Allocation to a Particular Security
|
Lowest Allocation to a Particular Security
|
Average Allocation
|
|
1
|
5.79%
|
1.66%
|
3.17%
|
|
2
|
6.24%
|
3.34%
|
5.16%
|
|
3
|
13.23%
|
1.45%
|
9.09%
|
|
4
|
10.65%
|
8.12%
|
8.77%
|
|
5
|
6.42%
|
0.29%
|
3.15%
|
Notes: the average allocations indicate the approximately equal weighting schemes applied in these portfolios. A few investments might attract a little more weight but usually any asymmetry in the weighting schedules leans towards underweighting of one or two securities.
The second important characteristic is absence of frequent trading or turnover of issues in the portfolios. Most of the portfolios, once formed, remained stationary for a number of years. It is therefore appropriate to suggest that the dominant strategy applied to these SMSF portfolios has been a buy-and-hold strategy. Importantly, this approach has probably served the SMSF trustees well and is accorded a great deal of support by empirical finance. In fact, it has been discovered that portfolio managers usually fail to outperform a buy-and-hold strategy. For example, Jensen (1968) in his now classic study found that no portfolio manager was able to consistently outperform (on a risk adjusted basis) an investment in T-bills and the market index during the period 1955 to 1964. More recent evidence has continued to support this finding and reaffirm the underlying soundness of the buy-and-hold approach.
The soundness of buy-and-hold derives from a combination of factors. Firstly, there are the implications of market efficiency. Investment managers do not appear to be able to consistently earn above equilibrium returns (unless they possess a competitive informational advantage). Secondly, an active trading strategy attracts higher transactions costs and management expenses. Elton, Gruber, Das and Hlavka (1993) reported that a low turnover approach outperformed portfolios with high turnover. Thirdly, frequent trading or portfolio rebalancing increases the chance that investors will miss out on being ‘in the market’ on strong days. Being out of the market on just a few days over any ten year period has been shown to place considerable downward pressure on the portfolio’s terminal value. For example, whilst the S&P 500 generated a compound annual return of 18 percent during the period 1982 to 1990, being out of the market for just 30 of the strongest days decreased the return to 5 percent (Strong, 2006, p. 389). The buy-and-hold strategy applied to the SMSFs is accorded strong empirical support.
The third important characteristic exhibited by the SMSF portfolios is the absence of a dollar-cost-averaging approach to building the portfolios. Rather than steadily acquiring securities over a medium to longer term, the portfolios tended to be constructed in a very short period of time—sometimes in just one or two trading days. This is exemplified by the portfolio presented in Table 3 above. The construction of a portfolio over such a short time horizon is inadvisable. On any particular trading day, share prices may exhibit unusual movements either on the upside or downside. Whilst a portfolio might fortuitously benefit from such movements (at least in the short term), there may be adverse effects reflected both in the volatility the portfolio exhibits and a higher average price paid for the selected securities. Conversely, a more gradual construction of the portfolio through a dollar-cost-averaging approach ensures that the investor buys more shares at lower prices and fewer shares at higher prices. Such a strategy increases the chance that the investor will pay a reasonable average price for the securities in the portfolio. The absence of such a strategy from the SMSFs in the sample is somewhat disconcerting.
The juxtaposition between finance theory and SMSF practice becomes critical once the discussion moves to portfolio construction and optimality. The analysis of the microstructure of the SMSFs in this sample has revealed a number of characteristics. First, cash and listed Australian equity securities (including property trusts) account for more than three-quarters of the total value of the portfolios. Second, the SMSF trustees held an average of 12 equity securities in their portfolios. Third, a large proportion of the equity investments are drawn from the consumer staples, consumer discretionary, financials, materials and industrials industry sectors. Fourth, the most popular equity investments among the SMSF trustees are Blue Chip securities drawn from the S&P/ASX 50 with middle capitalisation issues and, particularly, small capitalisation issues representing smaller proportions of the total number of securities chosen by the SMSF trustees for inclusion in their portfolios. In this section, these microstructure characteristics are utilised to build a SMSF portfolio that is ‘typical’ of the funds in our sample. The archetype portfolio is analysed using the tools of modern portfolio theory.
The SMSFs in this sample were formed during the last years of the 1990s and the early years of the 2000s. The majority of the portfolios were formed during 2003 and 2004. Given this, the archetype SMSF constructed here is assumed to come into existence on January 1 2004. The total amount of investable funds is $400,000. Of this, 19 percent or $76,000 is allocated to a cash account. An interest rate of 4.00% per annum is assumed to prevail. The remainder of the investable funds are allocated to twelve equity securities (including property trusts). The weighting scheme applied to the archetype SMSF is an equally weighted scheme and the investment strategy deployed is, in accordance with the apparent behaviour of the SMSFs in this sample, a buy-and-hold strategy. The equity securities were chosen for the portfolios on the basis of the ‘most popular’ securities and industry sectors identified in sections 4.1 and 4.2 (above).
|
Investment
|
Quantity
|
Purchase Dates
|
Average Cost of each Security
|
Total Dollar Cost
|
Weighting
|
|
|
|
|
|
|
|
|
Cash at Bank
|
|
|
|
|
|
|
Cash
|
76,000
|
|
|
76,000
|
19.00%
|
|
TOTAL
|
76,000
|
|
|
|
19.00%
|
|
Shares and Unit Trusts
|
|
|
|
|
|
|
AGL
|
3397.508
|
01/01/04
|
7.947
|
$27,000
|
6.75%
|
|
ANZ
|
1527.149
|
01/01/04
|
17.68
|
$27,000
|
6.75%
|
|
APN News and Media
|
6750
|
01/01/04
|
4
|
$27,000
|
6.75%
|
|
BHP
|
2214.93
|
01/01/04
|
12.19
|
$27,000
|
6.75%
|
|
Commonwealth Office
|
23478.26
|
01/01/04
|
1.15
|
$27,000
|
6.75%
|
|
CSL
|
1512.605
|
01/01/04
|
17.85
|
$27,000
|
6.75%
|
|
Fosters Group
|
6000
|
01/01/04
|
4.5
|
$27,000
|
6.75%
|
|
Paperlinx
|
5421.687
|
01/01/04
|
4.98
|
$27,000
|
6.75%
|
|
Suncorp
|
2250.75
|
01/01/04
|
11.996
|
$27,000
|
6.75%
|
|
Telstra
|
5601.66
|
01/01/04
|
4.82
|
$27,000
|
6.75%
|
|
Wesfarmers
|
1019.253
|
01/01/04
|
26.49
|
$27,000
|
6.75%
|
|
Woolworths
|
2288.136
|
01/01/04
|
11.8
|
$27,000
|
6.75%
|
|
TOTAL
|
|
|
|
324,000
|
81.00%
|
|
|
|
|
|
|
|
|
TOTAL FOR SMSF
|
|
|
|
400,000
|
100.00%
|
This archetype SMSF portfolio exhibits most of the characteristics of the SMSFs in the sample. There is a distribution of the equity portion of the portfolio across twelve equity securities and a variety of different industry sectors. The portfolio constituents were purchased on a single day rather than through a dollar-cost-averaging approach. After allocating approximately 20 percent of the portfolio to cash at bank, the weighting schedule apportions the remaining investable funds equally across the twelve equity securities. The strategy that is deployed from the inception date is a buy-and-hold strategy with no additions or subtractions to or from the portfolios. Whilst this archetype SMSF portfolio appears to be reasonably sound, closer inspection and analysis utilising the tools of modern portfolio theory is required in order to reach informed conclusions on the ‘soundness’ of this typical SMSF portfolio.
Careful analysis of the structure of the archetype SMSF portfolio reveals a number of important pieces of information regarding the diversification, expected return and risk exhibited by the portfolio. Of most concern from a portfolio management point of view, is the possibility that a large portion of the risk of the SMSF portfolio is attributable to firm-specific risk factors that might have been diversified away through the selection of additional securities for inclusion in the portfolio. More appropriate levels of diversification may increase expected returns and reduce the total risk of the portfolio. Similarly, the equal-weighted strategy that seems to have been applied, by and large, to the SMSF portfolios in the sample and which is reflected in the archetype portfolio, may be a suboptimal weighting schedule. A higher level of expected return may be obtainable from a reallocation of the investable funds among the chosen assets. Portfolio summary statistics for the archetype SMSF portfolio are presented below.
|
Portfolio Summary Statistic
|
Formula
|
Statistic Value
|
|
Expected Annual Return
|
 |
21.73% |
|
Annual Standard Deviation |
|
8.71% |
|
Beta |
|
0.725 |
|
Percentage of Total Variance Attributable to Systematic Factors (using Sharpe’s single index model) |
|
74.02% |
|
Percentage of Total Variance Attributable to Non-Systematic Factors (using Sharpe’s single index model) |
|
25.98% |
|
Treynor’s RVOL Ratio |
|
0.2184 |
The archetype portfolio has performed quite well over the period from 2004. Importantly, on a risk-adjusted basis, this portfolio has outperformed the unmanaged ASX All Ordinaries index (RVOL equals 0.17). However, the portfolio is reasonably under-diversified with approximately one-quarter of the fluctuations in its returns being attributable to firm-specific factors that could be diversified away. Not surprisingly, the solution of the relevant Markowitz portfolio programming problem reveals that it is possible to increase the expected annual return of the archetype portfolio by approximately four percentage points by abandoning the equal weightings initially accorded to the securities in the portfolio and re-weighting the portfolio in an efficient manner. The efficient portfolio that results exhibits a higher expected return and a lower beta coefficient (0.69).
It should be noted that the archetype portfolio incorporated ‘the best’ features of the SMSFs in the sample. The archetype portfolio accurately reflects most of the features of the SMSFs in the sample. However, in constructing the archetype portfolio the investable funds were distributed across different industry sectors to reflect the allocation of the investments on average across all funds. The result is an overstatement of the diversification exhibited by each of the SMSF portfolios examined individually. Also, the archetype portfolio contains the ‘most popular’ investments. This tends to result in an allocation of investable funds to what may be called the bluest of Blue Chip shares. In the context of the sample of SMSFs, the archetype SMSF is a best case example. Many of the SMSFs in the sample have, in reality, failed to emulate the performance of the archetype portfolio, even though the archetype portfolio itself is far from perfect.
The analysis presented in this paper revealed a number of characteristics of self managed superannuation funds that are worth noting. First, the 41 SMSFs in the sample contain an average of twelve equity securities selected from a total of 152 different listed Australian companies and unit trusts, one-quarter of which were drawn from the consumer staples and consumer discretionary industry sectors. Second, well-known Blue Chip issues are strongly represented across the portfolios with most of the constituents of the S&P/ASX 50 featuring in the portfolios. Third, the selection of the equity securities usually occurs on a roughly equally-weighted basis with purchases made over very short time horizons and without the benefits that may be derived from dollar-cost-averaging. Fourth, the portfolios exhibit very little trading activity, in some cases remaining stationary for a number of years. Finally, the portfolios appear to be somewhat under-diversified and potentially inefficient.
The juxtaposition of finance theory and SMSF practice reveals some interesting parallels and divergences. A theoretical justification for the existence of SMSFs may derive from the solution of a ‘covariance ignorance’ problem and the fact that the task of achieving portfolio optimality is relatively less difficult when the manager can ‘see’ the whole portfolio. There may be good theoretical reason for the preponderance of SMSFs in Australia. In accordance with empirical finance (and in non-accordance with theoretical finance), the SMSFs are characterised by considerable home bias and under-diversification. Whilst inconsistency with finance and portfolio theory appears to be the dominant theme of this paper, the buy-and-hold strategy utilised to manage the portfolios is accorded strong empirical support. The buy-and-hold strategy with its inherent infrequent trading combine to produce an investment strategy that has been shown to outperform more active portfolio management approaches.
The empirical facts reported herein, whilst based on a small sample, permit a first look at the microstructure of SMSFs. Despite the importance of SMSFs as a component of the retirement income stream in Australia, little is known about the structure of SMSF portfolios at the individual level. The analysis presented in this paper provides both reassurance and cause for concern about the management of SMSFs. Reassuringly the SMSFs appear to be reasonably conservative and not at all speculative, at least not blatantly so. However, the SMSFs contain too few investments to be classed as well diversified and the tendency to build the portfolios within very short time horizons is somewhat concerning. This fact and the absence of frequent trading seems to suggest that the SMSFs are formed when trustees decide to abandon their retail funds and invest this lump sum in a ‘one off’ fashion, potentially retaining a retail fund into which their employer makes contributions. Of course, it is possible that under-diversification and infrequent portfolio revisions may go hand-in-hand and represent evidence of the application of a favouritism (vis-à-vis a diversification) principle. These possibilities as well as the many other interesting characteristics exhibited by the microstructure of SMSFs offer numerous prospects for future research.
|
Company Name
|
Number of Portfolios with Holdings
|
|
ABC Learning Centres
|
4
|
|
Adelaide Bank
|
1
|
|
Adultshop.com.au
|
1
|
|
ALE Property
|
1
|
|
Alumina
|
6
|
|
Amcor Limited
|
2
|
|
AMP Limited
|
5
|
|
ANZ
|
21
|
|
AP Eagers
|
1
|
|
Apex Minerals NL
|
1
|
|
APN News and Media
|
8
|
|
ARB Corporation
|
1
|
|
ARC Energy
|
2
|
|
Ariadne
|
1
|
|
Aristocrat Leisure
|
1
|
|
Auselect
|
1
|
|
Australian Agricultural Co
|
1
|
|
Australian Gas and Light
|
8
|
|
Australian Infrastructure Fund
|
1
|
|
Australian Leisure and Hospitality Group
|
1
|
|
Australian Magnesium
|
4
|
|
Australian Pipeline Trust
|
1
|
|
Australian Stock Exchange
|
3
|
|
AWB Limited
|
2
|
|
Australian WorldWide Exploration
|
1
|
|
AXA
|
2
|
|
BHP Billiton
|
14
|
|
Billabong
|
1
|
|
Bluescope
|
8
|
|
Boom Logistics
|
2
|
|
Boral
|
2
|
|
Bresagen
|
1
|
|
Brian McGuigan Wines
|
1
|
|
Brickworks
|
1
|
|
Buderim Ginger
|
1
|
|
Caltex
|
1
|
|
Candle Australia
|
1
|
|
Chiquita Brands South Pacific
|
1
|
|
Clough Ltd
|
1
|
|
Coca Cola Amatil
|
7
|
|
Cochlear
|
1
|
|
Colarado
|
1
|
|
Coles Group
|
7
|
|
Collection House
|
2
|
|
Commonwealth Bank of Australia
|
9
|
|
Computershare
|
1
|
|
Commonwealth Property Office
|
9
|
|
Contango Microcap Limited
|
2
|
|
Croesus Mining
|
3
|
|
CSL
|
1
|
|
CSR Limited
|
3
|
|
David Jones
|
1
|
|
Envestra
|
1
|
|
Equigold
|
1
|
|
Euroz Limited
|
1
|
|
Excel Coal
|
1
|
|
Flight Centre
|
4
|
|
Foodland
|
4
|
|
Fosters Group
|
13
|
|
Gandel Retail Trust (CFS)
|
1
|
|
Company Name
|
Number of Portfolios with Holdings
|
|
General Property Group
|
5
|
|
Graincorp
|
1
|
|
Gunns
|
1
|
|
GWA International
|
1
|
|
Harvey Norman
|
2
|
|
Hhg Plc
|
1
|
|
HiTec Energy
|
2
|
|
Huntley Investment Co.
|
1
|
|
Iluka Resources
|
2
|
|
Ing Industrial Fund
|
5
|
|
Ion Limited
|
1
|
|
Insurance Australia Group
|
3
|
|
Integrated Research Limited
|
1
|
|
Iress Market Technology
|
1
|
|
John Fairfax Holdings
|
1
|
|
Leighton Holdings
|
6
|
|
Lend Lease
|
4
|
|
Lihir Gold
|
1
|
|
Lion Nathan
|
1
|
|
Looksmart
|
1
|
|
Macmahon Holdings
|
1
|
|
Macquarie Airport
|
1
|
|
Macquarie Countrywide
|
4
|
|
Macquarie Infrastructure Group
|
2
|
|
Macquarie Office Trust
|
1
|
|
Mayne Group
|
6
|
|
Metal Storm Limited
|
1
|
|
Metcash
|
1
|
|
Mirvac
|
1
|
|
National Australia Bank
|
21
|
|
Newcrest Mining
|
2
|
|
New Hope Corporation
|
4
|
|
News Corporation
|
1
|
|
Nick Scali Limited
|
1
|
|
Onesteel
|
1
|
|
Orbital Engine Corporation
|
1
|
|
Origin Energy
|
3
|
|
Pacific Brands
|
6
|
|
Pacific Hydro
|
1
|
|
Pacifica
|
1
|
|
Paperlinx
|
10
|
|
Pasminco
|
1
|
|
Patrick Corporation
|
3
|
|
Peptech Limited
|
1
|
|
Peppercorn Investment Fund
|
1
|
|
Perpetual
|
2
|
|
Platinum Capital
|
1
|
|
Prime Infrastructure (B&B Infrastructure)
|
1
|
|
Promina
|
2
|
|
Publishing and Broadcasting
|
2
|
|
Qantas
|
4
|
|
QBE
|
4
|
|
Q-Vis Limited
|
1
|
|
Repco
|
2
|
|
RG Capital Radio
|
0
|
|
Rinker Group
|
2
|
|
RIO
|
2
|
|
Ross Human Directions
|
1
|
|
Sam's Seafood
|
1
|
|
SFE Corporation
|
4
|
|
Sonic Healthcare
|
1
|
|
Sons of Gwalia
|
1
|
|
Southcorp
|
2
|
|
Southern Cross Broadcasting
|
1
|
|
Company Name
|
Number of Portfolios with Holdings
|
|
Starpharma Pooled Development
|
1
|
|
St George Bank
|
3
|
|
Stockland Trust
|
2
|
|
Suncorp Metway
|
25
|
|
TAB Limited
|
4
|
|
Tabcorp
|
8
|
|
TAB QLD
|
2
|
|
Tanami Gold NL
|
1
|
|
Ten Network
|
1
|
|
Telstra
|
25
|
|
Toll Holdings
|
2
|
|
Transurban
|
1
|
|
Van Eyk Blueprint International Shares
|
1
|
|
Ventractor Limited
|
1
|
|
Victoria Petroleum
|
1
|
|
Volante
|
1
|
|
Voxson Limited
|
1
|
|
Washinton H Soul Pattinson
|
4
|
|
Wesfarmers
|
5
|
|
Westel
|
1
|
|
Western Mining
|
6
|
|
Westfield America Trust
|
2
|
|
Westfield Holdings
|
4
|
|
Westpac
|
6
|
|
Wilson Investments
|
3
|
|
Woodside
|
3
|
|
Woolworths
|
16
|
Benartzi, S. and R.H. Thaler, 2002, “How Much is Investor Autonomy Worth?” Journal of Finance, Vol. LVII, No. 4, pp. 1593-1616.
Bilson, C., A. Frino, and R. Heaney, 2004, “Australian Retail Superannuation Fund Performance,” Accounting Research Journal, 17, pp. 43-56.
———, 2005, “Australian Retail Superannuation Fund Performance Persistence,” Accounting and Finance, 45, pp. 25-42.
Blume, M. and I. Friend, 1975, “Asset Structure of Individual Portfolios and some Implications for Utility Functions,” Journal of Finance, Vol. XXX, No. 2, pp. 585-603.
Campbell, J.Y., M. Lettau, B. Malkiel, and T. Xu, 2001, “Have Individual Stocks Become More Volatile? An Empirical Exploration of Idiosyncratic Risk,” Journal of Finance, pp.1–43.
Clark-Murphy, M. and P. Gerrans, 2001, “Choices and Retirement Savings: Some Preliminary Results on Superannuation Fund Member Decisions,” Economic Papers, 20, pp.29-42.
———, M.I. Kristofferson and P. Gerrans, 2002, “What Makes Superannuation Decisions Difficult?” International Journal of Business Studies, 10, pp. 73-94.
Coval, J.D. and T.J. Moskowitz, 1999, “Home Bias at Home: Local Equity Preference in Domestic Portfolios,” Journal of Finance, December, pp. 2045-2073.
Drew, M.E. and J.D. Stanford, 2001, “Asset Selection and Superannuation Fund Performance: A Note for Trustees,” Economic Papers, Vol. 20, No. 1, pp.57-65.
———2003, “Returns from Investing in Australian Equity Superannuation Funds, 1991-1999,” The Services Industries Journal, Vol. 23, No.4, pp.12-24.
Drew, M.E., J.D Stanford, and P. Taranenko, 2001, “Hot Hands and Superannuation Fund Performance: A Second Note for Trustees,” Economic Papers, Vol. 20, No. 4, pp.18-25.
Elton, E.J., M. Gruber, S. Das and M. Hlavka, 1993, “Efficiency with Costly Information: A Reinterpretation of Evidence from Manager Portfolios,” Review of Financial Studies, 6, 1, pp. 1-23.
Evans, J. and S. Archer, 1968, “Diversification and the Reduction of Dispersion: An Empirical Analysis,” Journal of Finance, December, pp.761–767.
Fry, T., Heaney, R. and McKeown, W. 2007, “Will Investors Change Their Superannuation Fund Given the Choice?” Accounting and Finance, 47, pp.267-283.
Gallagher, D. 2001, “Attribution of Investment Performance: An Analysis of Australian Pooled Superannuation Funds,” Accounting and Finance, Vol. 41, pp.41-62.
Goldman, M.B. 1979, “Anti-Diversification or Optimal Programmes for Infrequently Revised Portfolios,” Journal of Finance, Vol. XXXIV, No. 2, pp. 505-516.
French, K.R. and J.M. Poterba, 1991, “Investor Diversification and International Equity Markets,” American Economic Review, Vol. 81, No. 2, pp. 222-226.
Iyengar, S.S. and M. Lepper, 2000, “When Choice is Demotivating: Can One Desire Too Much of a Good Thing?” Journal of Personality and Social Psychology, Vol. 79, No. 6, pp. 995-1006.
Jensen, M.C. 1968, “The Performance of Mutual Funds in the Period 1955 to 1964,” Journal of Finance, Vol. XXIII, pp. 389-416.
Markowitz, H. 1952, “Portfolio Selection,” Journal of Finance, Vol. VII, No. 1, pp. 77-91.
Sharpe, W.F. 1981, “Decentralised Investment Management,” Journal of Finance, Vol. XXXVI, No. 2, pp. 217-234.
Strong, R.A. 2006, Portfolio Construction, Management and Protection, 4th edition, Thomson South-Western, Mason, Ohio.
Tversky, A. and C. Heath, 1991, “Preferences and Beliefs: Ambiguity and Competence in Choice Under Uncertainty,” Journal of Risk and Uncertainty, 4, pp. 5-28.
[1] Author: Peter J Phillips, School of Accounting, Economics and Finance, University of Southern Queensland, Toowoomba, Queensland, 4350. Telephone: 617 46315490. Email: phillipsp@usq.edu.au.
[2] It may be the case that the number of SMSFs eventually retracts from the current high numbers as investors realise that the increased choices do not bring increased utility and wind up their SMSF.
[3] The complete list of the Australian companies chosen by the SMSF trustees for their portfolios is contained in the appendix to this paper.
AustLII:
Copyright Policy
|
Disclaimers
|
Privacy Policy
|
Feedback
URL: http://www.austlii.edu.au/au/journals/JlLawFinMgmt/2007/2.html